The Internet’s Physical Backbone: Undersea cables, data centers, and IXPs
The Internet’s Physical Backbone: Undersea Cables, Data Centers, and IXPs
Introduction: The Myth of the “Cloud”
The internet is often conceptualized as an ethereal “cloud”—a weightless, invisible realm where data floats freely. In reality, this global network rests on an astonishing physical infrastructure spanning continents and oceans, consuming immense energy, and requiring constant human maintenance. This tangible framework—comprising submarine cables crossing ocean floors, humming data centers consuming small cities’ worth of electricity, and unassuming buildings where networks exchange traffic—forms the actual backbone of our digital world.
As Andrew Blum articulates in Tubes: A Journey to the Center of the Internet: “The Internet is not a cloud. It’s a collection of physical places connected by physical wires.” This article provides a comprehensive examination of the three pillars of internet infrastructure: undersea cables that connect continents, data centers that house our digital lives, and Internet Exchange Points where networks meet.
1. Undersea Cables: The Transoceanic Arteries
1.1 Historical Evolution: From Telegraph to Terabits
The Victorian Internet (1850s-1950s):
First transatlantic telegraph cable (1858): Failed after weeks, but proved concept
Global telegraph network by 1900: 200,000 miles of submarine cables
Key difference: Point-to-point connections vs. today’s shared fiber infrastructure
The Communication Revolution (1956-1988):
TAT-1 (1956): First transatlantic telephone cable (36 voice channels)
Coaxial cable era: Gradual increases in capacity
Satellite competition: 1960s-1980s saw satellites as primary transoceanic solution
The Fiber Optic Era (1988-Present):
TAT-8 (1988): First transatlantic fiber optic cable (280 Mbps)
Exponential capacity growth: Modern cables carry 200+ terabits per second
Current landscape: ~1.3 million kilometers of active submarine cables worldwide
1.2 Anatomy of a Modern Submarine Cable
Layered Construction:
Core: Hair-thin glass fibers (typically 4-8 pairs)
Coating: Protective layers around each fiber
Buffer: Gel-filled protection against water
Strength Members: Steel wires for tensile strength
Insulation: Copper sheathing for power transmission
Protective Layers: Multiple polyethylene coatings
Armor: Steel wires for shallow-water protection (not on deep-sea sections)
Typical Specifications:
Diameter: 17-50 mm (shallow water) vs. 17-25 mm (deep water)
Weight: 1-2 tons per kilometer (armored) vs. 0.5-1 ton/km (deep sea)
Repeater spacing: 50-150 km depending on cable design
Design life: 25 years (though many remain operational longer)
1.3 The Cable Laying Process
Survey Phase (6-12 months):
Bathymetric mapping of sea floor
Avoidance of geological hazards, shipwrecks, fishing zones
Negotiation of landing rights with coastal nations
Manufacturing Phase:
Continuous cable production in factories (up to 200km/day)
Repeater integration at specialized facilities
Testing of every kilometer before loading onto ships
Installation Phase:
Cable ships: Specialized vessels with dynamic positioning
Plowing: Buried 1-3 meters deep in shallow waters
Surface laying: Simply laid on ocean floor in deep waters
Branching units: Allow connections to multiple landing points
Post-Installation:
Burial documentation for future avoidance
Monitoring systems for fault detection
Maintenance agreements between cable consortium members
1.4 Global Cable Map and Strategic Chokepoints
Major Cable Systems:
FLAG Atlantic-1 (FA-1): 14,500 km, connecting US, UK, France
SEA-ME-WE 3/4/5: Southeast Asia-Middle East-Western Europe routes
Africa Coast to Europe (ACE): Connecting West Africa to Europe
Google’s Dunant: First 12-fiber pair cable (250 Tbps capacity)
Facebook’s 2Africa: Will become world’s largest cable system (37,000 km)
Strategic Chokepoints:
Strait of Malacca: 25+ cables concentrated in narrow passage
Suez Canal: Critical Mediterranean-Asia junction
Luzon Strait: Between Taiwan and Philippines
English Channel: Highest density of cables worldwide
Geopolitical Considerations:
China’s Digital Silk Road: Belt and Road Initiative includes submarine cables
US-China tensions: Battle for Pacific cable dominance
Island nations: Becoming cable hubs (Guam, Cyprus, Mauritius)
Arctic routes: Melting ice opening new northern passages
1.5 Vulnerabilities and Protection
Natural Threats:
Earthquakes: 2006 Hengchun earthquakes severed 9 cables
Sharks: Less common than myth suggests but documented
Fishing trawlers: Most common cause of cable damage (40-50% of faults)
Anchors: Particularly damaging in congested shipping lanes
Human Threats:
Intentional sabotage: Limited but increasing concern
Espionage: Tapping cables in territorial waters
Theft: Copper sheathing has been stolen in some regions
Protection Measures:
No-fishing zones: Around critical cable routes
Burial requirements: Up to 3 meters in shallow waters
Cable protection zones: Legal frameworks in many countries
Monitoring systems: Real-time surveillance of cable integrity
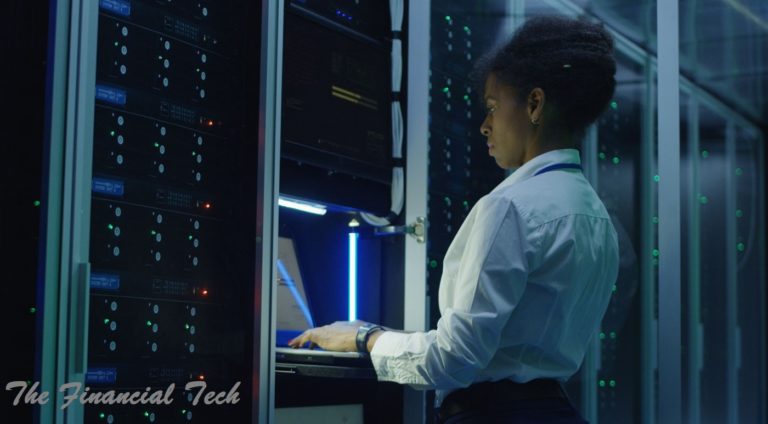
2. Data Centers: The Digital Heartlands
2.1 Evolution from Computer Rooms to Cloud Campuses
Mainframe Era (1960s-1980s):
Single-organization computer rooms
Raised floors, chillers, UPS systems
Limited connectivity to other facilities
Colocation Boom (1990s-2000s):
Carrier hotels and colocation facilities
Multi-tenant models emerge
Early internet companies require reliable hosting
Hyperscale Era (2010s-Present):
Facebook, Google, Amazon, Microsoft building mega-campuses
Facilities exceeding 1 million square feet
Specialization: Different designs for compute, storage, AI workloads
2.2 Anatomy of a Modern Hyperscale Data Center
Site Selection Criteria:
Geological stability: Low earthquake risk
Cooling potential: Access to water or cool air
Energy availability: Reliable, affordable power
Network connectivity: Proximity to fiber routes
Tax incentives: Often determining factor for locations
Power Infrastructure:
Typical consumption: 30-100+ megawatts per facility
Comparison: Equivalent to 30,000-100,000 homes
Redundancy: N+1 or 2N power systems
On-site generation: Often includes diesel generators
Grid integration: Some participate in demand response programs
Cooling Systems Evolution:
Computer Room Air Conditioning (CRAC): Traditional raised-floor cooling
Hot/Cold aisle containment: Separating intake/exhaust air
Free cooling: Using outside air when conditions permit
Liquid cooling: Direct-to-chip or immersion cooling for high-density racks
Ocean/river cooling: Facebook’s Sweden center uses Baltic Sea water
Compute Density Trends:
2000: 1-2 kW per rack
2010: 5-10 kW per rack
2020: 15-30 kW per rack (standard)
2024: AI clusters reaching 50-100+ kW per rack
2.3 The Global Data Center Geography
Major Concentration Zones:
Northern Virginia: “Data Center Alley” hosts 70% of global internet traffic
Silicon Valley: Declining relative share but still significant
Dublin, Ireland: European cloud hub benefiting from climate and taxes
Singapore: Southeast Asia’s primary hub despite space/power constraints
Beijing/Tianjin: China’s northern cluster
Emerging Frontiers:
Nordic countries: Iceland, Norway, Sweden with cheap renewable energy
Chile: Strategic position for Latin America-Southern Cone connectivity
Middle East: UAE and Saudi Arabia investing heavily
Africa: Johannesburg, Nairobi, Lagos emerging as regional hubs
The “Follow the Sun” Architecture:
Content delivery networks placing data near users globally
Trading firms locating servers milliseconds closer to exchanges
Cloud providers building regions based on customer concentration
2.4 Sustainability Challenges and Innovations
Energy Consumption Reality:
Global estimate: 1-2% of worldwide electricity (growing)
Projection: Could reach 4% by 2030 without efficiency improvements
Carbon emissions: Vary dramatically by energy grid
Innovations in Efficiency:
Power Usage Effectiveness (PUE) improvements:
2007 average: 2.5 (for every watt to IT, 1.5 to cooling/power)
2024 hyperscale: 1.1-1.3 (Google’s average: 1.10)
Renewable energy procurement: Google, Microsoft, Amazon are largest corporate buyers
Heat reuse: Warming community buildings in Nordic countries
Circular economy: Facebook’s data centers designed for disassembly
Water Usage Concerns:
Revelation: Microsoft’s Arizona data center to use 56 million gallons annually
Innovations: Air-cooled designs, closed-loop systems
Regulatory pressure: Increasing in water-stressed regions
2.5 Specialized Facilities
Content Delivery Network (CDN) Edge Nodes:
Thousands of small facilities globally
Typically 10-50 racks each
Located in internet exchanges or carrier hotels
Purpose: Cache content closer to end-users
Carrier Hotels and Colocation Hubs:
One Wilshire (Los Angeles): Pacific Rim interconnection hub
60 Hudson (New York): Historic telegraph building turned digital hub
Equinix DC1-15 (Ashburn, VA): Core of Data Center Alley
Telehouse (London): European interconnection center
Government and Financial Facilities:
NSA data centers: Utah Data Center (1 million sq ft, $1.5B cost)
Trading colocation: Sub-millisecond proximity to exchange servers
Disaster recovery sites: Geographically distant backup facilities
3. Internet Exchange Points (IXPs): The Network Meeting Points
3.1 What IXPs Do and Why They Matter
The Peering Principle:
Transit vs. Peering: Paying for connectivity vs. free exchange
Public peering: Multiple networks connect at shared fabric
Private peering: Direct connection between two networks
Settlement-free peering: No money changes hands
Key Benefits:
Reduced latency: Avoiding extra hops through transit providers
Cost reduction: Less paid transit required
Improved performance: More direct routing between networks
Resilience: Multiple interconnection options
3.2 Physical Infrastructure of IXPs
Switching Fabric Evolution:
Ethernet switches: Standard Layer 2 switching
Route servers: Simplify multilateral peering
Software-Defined Exchange (SDX): More flexible, programmable peering
Virtual cross-connects: Remote peering capabilities
Facility Requirements:
Carrier-neutral colocation space
Diverse fiber entry points
High-capacity power with redundancy
Physical security measures
24/7 technical support
Major Global IXPs:
DE-CIX Frankfurt: World’s largest by peak traffic (14+ Tbps)
AMS-IX Amsterdam: Historic European hub
LINX London: One of the world’s first IXPs
Equinix exchanges: Global platform of interconnected facilities
3.3 The Economics of Interconnection
Business Models:
Non-profit member associations (LINX, AMS-IX)
Commercial operators (Equinix, Digital Realty)
Hybrid models (DE-CIX combines both)
Pricing Structures:
Port-based: Charge per port speed (10G, 100G, 400G)
Volume-based: Charges based on traffic volume
Membership fees: Annual fees for participating networks
Cross-connect fees: Charging for physical connections within facility
The “Peering Ecosystem”:
Tier 1 networks: Don’t pay for transit (heavily peered)
Content providers: Major sources of traffic (Google, Netflix, Facebook)
Access networks: ISPs bringing end-user traffic
Cloud providers: Interconnecting with enterprise networks
3.4 Growth in Emerging Markets
African IXP Development:
Nairobi (KIXP): One of Africa’s largest and most successful
Johannesburg (JINX): Key Southern Africa hub
Lagos (IXPN): Growing West African exchange
Impact: Up to 90% reduction in local latency, 80% cost savings
Challenges in Developing Regions:
Regulatory barriers: Monopolies resisting interconnection
Limited technical expertise: Need for capacity building
Physical infrastructure: Reliable power and connectivity
Commercial models: Sustainable funding for operations
Success Stories:
Bangladesh: BDIX transformed local internet performance
Brazil: PTT Metro created vibrant ecosystem
Middle East: UAE-IX attracting regional networks
4. Interdependencies and Systemic Risks
4.1 Critical Infrastructure Interactions
Cable Landing Stations → Data Centers:
Typical flow: Cable lands → Carrier hotel → Backbone network → Data center
Location strategy: Data centers cluster near cable landing points
Ashburn example: Proximity to multiple transatlantic cables
Data Centers → IXPs:
Content providers: Place servers at IXPs for optimal peering
Cloud on-ramps: Direct connections from IXPs to cloud providers
The “flywheel effect”: More networks attract more content attracts more networks
IXPs → Network Backbones:
Backbone interconnection: Major networks meet at key IXPs
Regional distribution: IXPs distribute traffic to regional networks
The “tiered” internet: How traffic flows between access, regional, backbone networks
4.2 Systemic Vulnerabilities
Single Points of Failure:
Cable concentration: Too many cables through same choke points
Power dependence: Data centers reliant on specific power grids
Geographic clustering: Northern Virginia’s dominance creates systemic risk
Supplier concentration: Limited vendors for critical equipment
Cascading Failure Scenarios:
Cable cut → Traffic reroutes → Congestion at alternate paths
DDoS attack → Overwhelms IXP capacity → Affects all connected networks
Power outage → Data center fails → Services unavailable globally
Natural disaster → Multiple infrastructure elements affected simultaneously
Security Concerns:
Physical security: Protection against sabotage or theft
Supply chain security: Trust in equipment manufacturers
Cyber-physical attacks: Digital attacks affecting physical infrastructure
State-sponsored threats: Infrastructure as geopolitical target
4.3 Resilience and Redundancy Strategies
Geographic Diversity:
Multi-region deployment: Cloud providers across continents
Cable path diversity: Avoiding single points of failure
Disaster recovery sites: Hundreds of kilometers between primary and backup
Network Architecture:
Anycast routing: Multiple locations serving same IP addresses
Load balancing: Distributing traffic across multiple paths
Failover automation: Automatic rerouting around failures
Industry Initiatives:
Mutually Agreed Norms for Routing Security (MANRS): Improving routing security
Cable protection agreements: International cooperation on cable security
Data center resilience standards: Uptime Institute Tier standards
5. Future Trends and Developments
5.1 Technological Evolution
Submarine Cable Advances:
Space-division multiplexing: More fiber pairs per cable
Open cable systems: Disaggregating wet and dry components
Branching unit flexibility: Dynamic reconfiguration capabilities
Power feeding innovations: More efficient power transmission
Data Center Innovations:
AI-optimized designs: Different requirements for AI vs. traditional compute
Edge computing proliferation: Thousands of micro-data centers
Sustainable designs: Net-zero carbon, water-positive facilities
Automated operations: Robotics for maintenance and repairs
IXP Evolution:
Intercontinental IXPs: Remote peering across oceans
Virtual interconnection: Software-defined peering
Specialized exchanges: For IoT, financial, or research traffic
5.2 Geographic Shifts
Climate-Driven Relocation:
Heat waves affecting cooling efficiency in traditional locations
Water scarcity limiting certain regions
Renewable energy availability driving site selection
Potential winners: Nordic countries, Canada, Patagonia
Geopolitical Realignment:
US-China decoupling affecting cable routes
BRICS countries developing independent infrastructure
Arctic routes becoming viable with climate change
Africa developing intra-continental connectivity
Urban vs. Rural Balance:
Edge computing: Bringing infrastructure closer to users
Rural data centers: Utilizing cheaper land and energy
Urban micro-centers: Meeting low-latency requirements in cities
5.3 Policy and Regulation
Data Sovereignty Laws:
Requirements for data to remain within national borders
Impact on global cloud architecture
Emergence of “data embassies” for diplomatic data protection
Sustainability Regulations:
Carbon emission reporting requirements
Water usage limitations
Circular economy mandates for hardware
Security Standards:
Critical infrastructure protection laws
Supply chain security requirements
Resilience standards for cloud providers
Conclusion: The Tangible Foundations of Our Digital World
The internet’s physical infrastructure represents one of humanity’s most remarkable engineering achievements—a globally distributed, real-time nervous system that has fundamentally transformed civilization. From the ocean floors crisscrossed by fiber-optic cables to the vast data centers humming with computation to the unassuming buildings where networks exchange traffic, this physical layer remains largely invisible to end users yet forms the essential foundation of digital life.
Three key realities emerge from examining this infrastructure:
The internet is profoundly physical: Every byte travels through copper, glass, or air, consuming real energy and requiring physical maintenance.
It is inherently global yet locally concentrated: While spanning the planet, critical infrastructure clusters in specific regions due to economic, geographic, and historical factors.
It is both resilient and fragile: Designed with redundancy yet vulnerable to concentrated attacks, natural disasters, and systemic risks.
As we look to the future, several challenges loom:
Sustainability: Balancing growing demand with environmental constraints
Equity: Ensuring global access not determined by infrastructure geography
Security: Protecting critical infrastructure in an increasingly contested world
Governance: Developing frameworks for global infrastructure with local impacts
The evolution of this infrastructure will shape the internet’s next chapter. Will it become more centralized in massive hyperscale facilities or distributed through edge computing? Will it follow clean energy sources or maintain traditional locations? Will it reinforce existing digital divides or help bridge them?
Ultimately, understanding the internet’s physical backbone reminds us that digital transformation rests on material foundations. As we build the metaverse, expand artificial intelligence, and connect billions more devices, we must remember that all these virtual capabilities depend on very real cables, servers, and exchange points—the unsung heroes of our connected age.
Key Statistics and Data Points
Submarine cables: Carry ~99% of international data traffic
Total cable length: Enough to wrap around Earth 30+ times
Data center electricity: Could power all UK homes twice over
IXP traffic growth: 45% CAGR in emerging markets
Cost of cable cut: Estimated $100,000-$1,000,000 per hour for financial sector
Further Resources
Submarine Cable Map: https://www.submarinecablemap.com/
Data Center Map: https://www.datacentermap.com/
PeeringDB: Database of networks and interconnection data
Telegeography: Research on global internet infrastructure
The internet may live in the cloud, but it’s built on steel, glass, and silicon—a testament to human ingenuity in creating connections that transcend geography while remaining firmly grounded in physical reality.