Leveraging Data and Analytics to Optimize Your Ad Network Performance
Introduction: The New Currency of Digital Publishing
In the rapidly evolving landscape of digital advertising, data has transcended its traditional role as a retrospective reporting tool. It is now the primary input that drives real-time decisions, shapes programmatic strategy, and determines which publishers thrive and which stagnate. The shift from human-directed optimization to AI-driven, data-dependent systems has fundamentally changed how ad networks perform—and how publishers must approach their monetization strategy .
This guide provides a comprehensive framework for leveraging data and analytics to optimize your ad network performance in 2026. Drawing on industry research, platform updates, and proven publisher strategies, you will learn how to measure the right metrics, identify performance bottlenecks, enrich your data signals, and build a continuous optimization discipline that maximizes revenue across all demand sources.
Part 1: The Data-Centric Paradigm Shift
1.1 From Human Rules to Machine Learning
For years, advertising optimization revolved around human judgment: selecting keywords, adjusting bids, and swapping creative based on intuition and basic performance metrics. This approach has been fundamentally superseded.
Modern ad platforms—Google Ads, DV360, The Trade Desk, and commerce media networks—operate on machine learning models that require high-quality, consistent data to function effectively . These systems don’t simply execute predefined rules; they learn from historical conversion data to predict which impressions, audiences, and creative combinations will deliver results.
“When the advertising system increasingly relies on its own judgment, whether data is stable, reliable, and complete begins to directly impact performance outcomes.” — Turing Digital
This paradigm shift has profound implications. Data is no longer just for retrospective reporting; it is the fuel that powers the engine of your ad delivery. If your data is fragmented, incomplete, or inconsistent, the system’s “learning” will be misdirected, and your performance will suffer regardless of how much budget you allocate .
1.2 Data Quality as a Prerequisite, Not a Differentiator
In the era of third-party cookie deprecation and increasing privacy regulation, data quality has moved from being a “nice to have” to a baseline requirement for maintaining performance . The signals that platforms can access directly are diminishing. This makes the quality of the data you provide—through your own tagging, first-party data collection, and server-side integration—the critical determinant of how accurately the system can model user behavior.
Key implications for publishers:
The introduction of Google Tag Gateway, which serves the Google tag from a publisher’s own server infrastructure, illustrates this priority: advertisers who adopted it observed an average 14% uplift in conversions due to improved data quality and measurement resilience .
Part 2: The Publisher’s Data Foundation
Before any optimization can occur, publishers must establish a robust data foundation. This means ensuring that every impression, click, and conversion is captured accurately and consistently.
2.1 Core Data Sources to Integrate
2.2 Implementing Enhanced Measurement
Standard tagging often misses conversions that occur across devices or in environments where traditional identifiers are unavailable. Enhanced measurement solutions address these gaps:
Enhanced Conversions: Hashed first-party customer data is used to match conversions to ad interactions, recovering conversions that would otherwise be lost. Advertisers bidding to conversion value who implement Enhanced Conversions see an average 8% incremental ROAS on Google Search campaigns .
Conversion Modeling: Google’s AI models fill remaining measurement gaps, providing a more complete picture of performance. For example, Carwow used Enhanced Conversions to better connect YouTube ad views to sales leads, resulting in a 7% increase in overall attributed conversions .
2.3 The Importance of View-Through Conversions
One of the most significant gaps in standard reporting is the treatment of view-through conversions—users who see a display ad, do not click, but later convert via another channel. These conversions are systematically undervalued by last-click models, yet they represent the true impact of upper-funnel advertising .
Publishers and advertisers must ensure that view-through conversions are:
Included in reporting columns (not just click-based conversions)
Evaluated with appropriate attribution windows
Considered in optimization decisions, not dismissed as “soft metrics”
“View-throughs can dramatically change which channels look like top performers depending on how attribution is set up. The ad platform might show CTV driving conversions via view-through. But the ad server might not agree.”
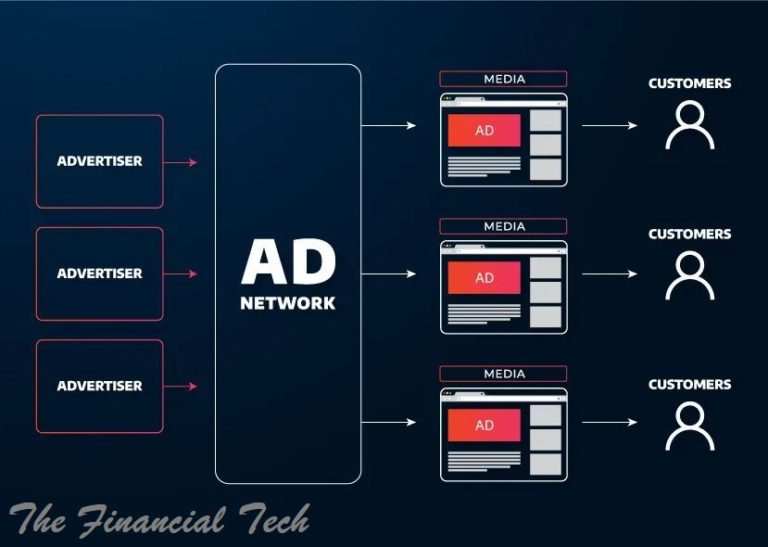
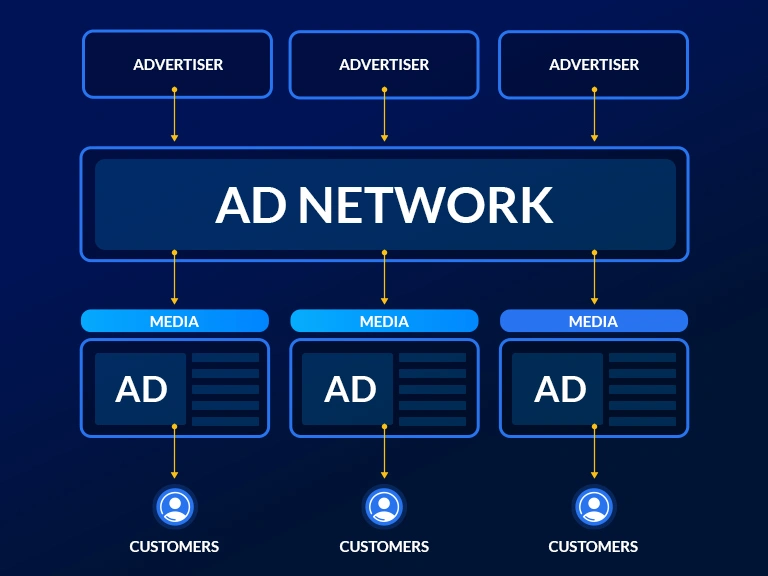
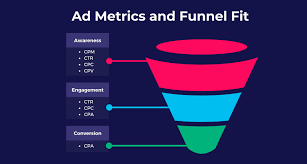
Part 3: The Ad Funnel Framework for Performance Analysis
To optimize ad network performance, publishers must understand how ads progress through the key stages of the advertising funnel. Commerce media networks have pioneered a structured approach to this analysis, which applies broadly across all ad network types .
3.1 The Five Stages of the Ad Funnel
A finely tuned ad funnel ensures you’re making the most of your traffic, maximizing fill rates, and ultimately increasing revenue-driving clicks and transactions .
3.2 Diagnosing Performance by Funnel Stage
Each stage of the funnel points to specific optimization opportunities:
Stage 1: Slots Available – “Am I generating enough traffic?”
If all subsequent metrics look solid but ad calls are low, the root issue is likely insufficient traffic or poorly monetized high-traffic pages.
How to improve :
Ensure high-traffic pages are properly monetized with multiple ad slots
Place ads where they align with user intent in highly trafficked site sections
Add more ad slots to existing pages (if downstream metrics are strong)
Stage 2: Slots Filled – “Do I have enough advertisers?”
A healthy fill rate is 80-95% . If your fill rate is too high (approaching 100%), you may be leaving revenue on the table by not charging enough. If too low, you need more advertiser demand.
How to improve high fill rates :
How to improve low fill rates :
Recruit more advertisers, including long-tail advertisers that collectively unlock revenue
Unblock unspent budget from existing advertisers by improving spend efficiency
Leverage programmatic demand through SSP integration to access DSPs like DV360 and The Trade Desk
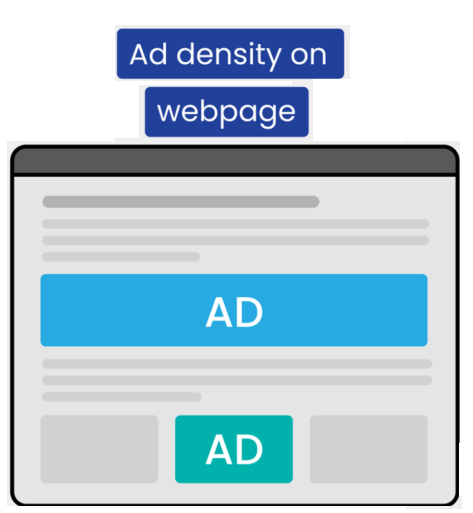
Stage 3: Impressions – “Are users seeing the ads?”
Even with strong demand and traffic, impressions can be low due to poor placement or technical issues preventing ad rendering.
How to improve :
Optimize placements to high-visibility areas (above the fold, within engaging content)
Check technical integrations to ensure ads load properly on all devices
Optimize creative load times to reduce latency and improve viewability
Stage 4: Clicks – “Are customers engaging with ads?”
If impressions are high but CTR is low, the issue is likely irrelevant ads, weak creative, or poor format selection.
How to improve :
Improve creative assets (high-resolution, mobile-optimized, compelling copy with clear CTAs)
Enhance targeting through Quality Score algorithms that prioritize relevant ads
A/B test different ad formats (video vs. display, sponsored listings vs. sponsored brands)
Stage 5: Transactions – “Are ads driving purchases?”
This is the bottom of the funnel and the most critical metric for performance-based advertisers.
How to improve :
Maximize inventory with AI-driven bid automation to prioritize likely converters
Improve retargeting through customer segmentation and cross-device strategies
Enhance post-click experience (landing page speed, mobile optimization, simplified checkout)
Part 4: Advanced Yield Optimization Strategies
4.1 Understanding Yield Optimization
Yield optimization is the practice of working on various optimization techniques and analyzing extensive data in an attempt to maximize the value of digital advertising . For publishers, this means studying relevant data, analyzing elements to identify needs for change or upgrades, and adjusting strategies to maximize revenue and efficiency.
“Yield optimization is the ideal pricing strategy for publishers.” — AdPushup
4.2 Key Channels for Yield Management
Publishers have three primary channels for maximizing yield, each with distinct characteristics :
4.3 Advanced Yield Strategies
1. Geo-Targeting
Target location-appropriate inventory to audiences in specific geographic areas, offering a more relevant user experience. Ad servers can prioritize inventory for users based on proximity to physical businesses .
2. Ad Refresh
Dynamically update ads displayed on a webpage during a single user session, increasing the number of impressions per visit. This is achieved by automatically refreshing ad sets based on specific conditions or triggers .
3. Inventory Optimization by Season
Adjust inventory strategy for seasonal peaks (Christmas, Thanksgiving, etc.). Test strategies well before major events to optimize performance .
4. Ads.txt Management
Maintain an accurate, up-to-date ads.txt file (IAB standard) that declares authorized sellers of your inventory. This attracts more qualified bidders, increases competition, and leads to higher ad rates .
5. Ad Block Recovery
With nearly one-third of internet users employing ad blockers, publishers lose significant revenue . Implement ad recovery solutions that bypass blockers while maintaining compliance and user experience.
6. Traffic Shaping
Use AI-driven traffic-shaping tools to reduce redundant bids and ensure more accurate auction outcomes. These models help publishers focus on high-value inventory while eliminating inefficiencies like request duplication . One such platform optimizes 120 billion impressions per month for its clients .
4.4 Bid Request Enrichment
Enriching bid requests with additional data signals can dramatically improve both bid response rates and bid prices. When publishers provide clearer signals about the impression opportunity, advertisers can bid more confidently and competitively .
Signals that drive value:
Content-related fields: genre, channel, network, livestream status, rating, language
Geography signals
Identity-related signals (universal IDs)
Results: One publisher using signal enrichment saw a 57% increase in bid response rate, which typically correlates with higher revenue . When signals like genre, channel, or universal ID were included, it resulted in an increase in bid price .
For publishers, the strategic approach is to work with a technology partner that allows easy, automated population of bid request fields while maintaining control over what is shared .
Part 5: Platform-Specific Optimization Tactics
5.1 Google Ad Manager Optimization
Network Performance Analysis
Use the Segment feature in Google Ads and Microsoft Advertising to check performance by network. Search partner networks can be volatile—sometimes performing well, other times generating bot traffic. If a network consistently underperforms, consider excluding it .
Key metrics to segment:
Bidding Strategy Testing
If your campaigns have been using the same bidding strategy for an extended period, test alternatives:
Google has been suggesting that all advertisers, even lead generation businesses, start assigning values to their conversion actions. This opens up maximize conversion value and target ROAS strategies, focusing on revenue rather than just conversions .
Recommendations Management
Review the Recommendations tab regularly for ideas, but turn off auto-apply for recommendations. Some suggestions follow platform best practices; others may be self-serving. Review recommendations manually and apply only those aligned with your goals .
5.2 Commerce Media Network Optimization
For publishers operating commerce media networks (retail media, marketplaces), the ad funnel framework is particularly relevant. Commerce media networks should :
Monitor budget utilization among existing advertisers. If below 10%, work with advertisers to improve spend efficiency through real-time insights and recommendations.
Expand to non-endemic advertisers looking to enter commerce media advertising.
Integrate SSPs to access DSPs like DV360 and The Trade Desk, broadening advertiser reach.
5.3 Header Bidding Optimization
Header bidding allows multiple demand partners to compete simultaneously, but it requires careful optimization :
Timeout settings: Balance revenue and user experience through testing (typically 1,000–2,000ms)
Partner management: Focus on 5–12 quality partners rather than maximum quantity
Price floors: Set strategic, dynamic floors based on historical bid data
“Header bidding satisfies the need for maximum competition and yield.”
Part 6: Attribution and Cross-Channel Measurement
6.1 The Data Conflict Triangle
Many publishers and advertisers face what industry experts call the data conflict triangle: platform-reported data vs. ad server data vs. internal analytics . These sources rarely align perfectly because:
Platforms self-attribute using their own models
Ad servers use stricter attribution windows and favor last-click
Internal data (CRM, analytics) reflects actual business outcomes
The solution is not to declare one source “right” but to understand what each reveals and use them in combination .
6.2 Attribution Models to Compare
To understand the true influence of each channel, compare multiple attribution models :
Channels like podcasts, CTV, and display may look weak in last-click but strong in assist roles. If these channels show lift in first-touch or assist models, that’s a signal, not a failure .
6.3 Incrementality Testing
Prove campaign impact with incrementality testing—comparing a group exposed to your ads to a control group that wasn’t. This answers the crucial question: “Would my customers have converted anyway?”
Google has recently made incrementality testing much more accessible, with new methods significantly lowering the investment threshold, making it possible to run rigorous tests across more campaign types—even with smaller budgets .
6.4 Proxy Signals for Hard-to-Measure Channels
In cross-device or mobile-heavy journeys, where direct tracking fails, use proxy indicators :
Even imperfect signals can guide better decisions than click-only data.
Part 7: Continuous Optimization Processes
7.1 Building an Optimization Schedule
Create a structured optimization cadence to ensure continuous improvement :
7.2 Long-Term Performance Reviews
Conduct longer-term reviews (90, 180, 365 days) to identify patterns invisible in shorter windows :
What keywords have been spending small amounts that total to large sums without converting?
What’s in the account but driving no impressions?
What’s driving the majority of conversions—are you paying enough attention?
What keywords convert at lower frequencies but total to meaningful volume with decent CPA?
“You may find that you’re not actually aware of some converting keywords that should be higher on your priority list.”
7.3 Creative Testing and Refinement
Ad creative is the only thing that gets your brand’s message in front of the user. You can have perfect targeting, but if your ad gets lost, no one will ever know .
Creative optimization best practices:
Use all available assets: For Responsive Search Ads, use 15 headlines and 4 descriptions. Each can be dynamically rotated to find winning combinations .
Develop ad copy testing themes and stick with them. Pin assets that define your core message.
Fill all ad assets (sitelinks, callouts, structured snippets, business name, logo) to take up more space with compelling messaging .
7.4 Evaluation of Auto-Applied Recommendations
Google and Microsoft provide optimization recommendations, and sometimes they automatically apply them. Review and control these settings :
Navigate to the Recommendations tab
Click the Auto-Apply icon in the upper right
View all recommendations currently being auto-applied
Uncheck any you don’t wish the platforms to make on your behalf
Part 8: Strategic Frameworks for 2026 and Beyond
8.1 Curation as a Growth Strategy
In a programmatic landscape characterized by inventory overload and duplication, curation has emerged as a powerful strategy for both buyers and sellers .
What curation does:
Pre-filters supply based on buyer preferences
Reduces the flood of unnecessary bid requests
Creates premium inventory packages that command higher CPMs
Results: Advertisers using curation platforms see a 40% increase in win rate and 23% lower cost on average . 80% of publishers using curated marketplaces generated incremental revenue from unique demand .
8.2 First-Party Data as the New Currency
With third-party cookies deprecated, first-party data has become the foundation of sustainable monetization. Publishers must :
Build stable, consistent data collection infrastructure
Integrate CRM data into advertising systems
Use identity solutions (UID2, LiveRamp) to maintain addressability
Leverage data clean rooms for secure data collaboration
8.3 Balancing Platform Recommendations with Strategic Judgment
Platform recommendations can be valuable sources of ideas—new keywords, ad copy variants, bidding strategies—but they should be evaluated through the lens of your specific goals .
“I think it would take a pretty big ego to ignore any suggestions around potential keywords and ad copy without even reviewing the options. It’s free ideas with no strings attached. What’s to hate?”
Use recommendations as suggestions for work projects, not as directives to be blindly followed.
Part 9: Common Pitfalls and How to Avoid Them
Part 10: The 2026 Publisher’s Optimization Checklist
Daily
Monitor delivery against goals
Check fill rates and bid density
Review for anomalies (traffic spikes, performance drops)
Verify ad server and analytics data alignment
Weekly
Review performance by campaign, ad group, placement
Pause clearly underperforming elements
Check network performance reports
Monitor viewability metrics
Monthly
Conduct creative asset performance review
Refresh underperforming creative
Review and adjust price floors
Check recommendations tab for ideas
Review block lists for brand safety vs. revenue balance
Quarterly
Long-term keyword/audience review
Test new bidding strategies via experiments
Conduct incrementality tests for key channels
Review attribution model comparisons
Audit technical implementation (tags, enhanced conversions)
Seasonally
Pre-peak inventory optimization
Review seasonal demand patterns
Plan curated inventory packages
Evaluate new demand partners
Conclusion: Data as the Engine of Performance
The optimization of ad network performance in 2026 is fundamentally a data discipline. The publishers who succeed are those who:
Build a robust data foundation with consistent, high-quality signals across all touchpoints
Understand the full funnel from available inventory to final transactions, diagnosing bottlenecks at each stage
Enrich their data through bid request signals, enhanced conversions, and first-party integration
Optimize systematically with structured processes, regular reviews, and continuous testing
Measure holistically using multi-touch attribution, incrementality testing, and proxy signals where direct tracking fails
Stay strategic with curation, first-party data development, and thoughtful evaluation of platform recommendations
“The opportunities are in the details.”
The difference between flat revenue and sustained growth lies not in dramatic pivots but in the cumulative impact of dozens of small, data-driven optimizations executed consistently over time.
In an era where AI systems make more decisions than humans, the quality of the data you feed those systems determines the quality of the outcomes you receive. Data is not just something you report on; it is the engine of your performance.
Your ad networks are only as good as the data you give them. Make sure it’s the best data possible.