The Advertiser’s Guide: How to Use Ad Networks to Reach Your Audience in 2026
Introduction: The Intermediary Advantage
In the fragmented digital landscape, reaching your target audience efficiently is both the greatest opportunity and the most persistent challenge for advertisers. Direct relationships with individual publishers are impractical for all but the largest brands. The solution—ad networks—has evolved from simple inventory aggregators into sophisticated, AI-driven platforms that connect advertisers with audiences across millions of sites, apps, and devices.
This guide is for the advertiser who wants to master those platforms.
Drawing on 2026 best practices, platform capabilities, and performance data, this comprehensive guide provides a strategic framework for using ad networks effectively. You will learn how ad networks operate, which targeting levers to pull, how to structure campaigns for machine learning optimization, and how to measure success beyond last-click attribution.
Whether you are launching your first campaign or refining a mature program, this is your complete playbook.
Part 1: What Are Ad Networks and Why Should Advertisers Use Them?
1.1 Defining the Ad Network
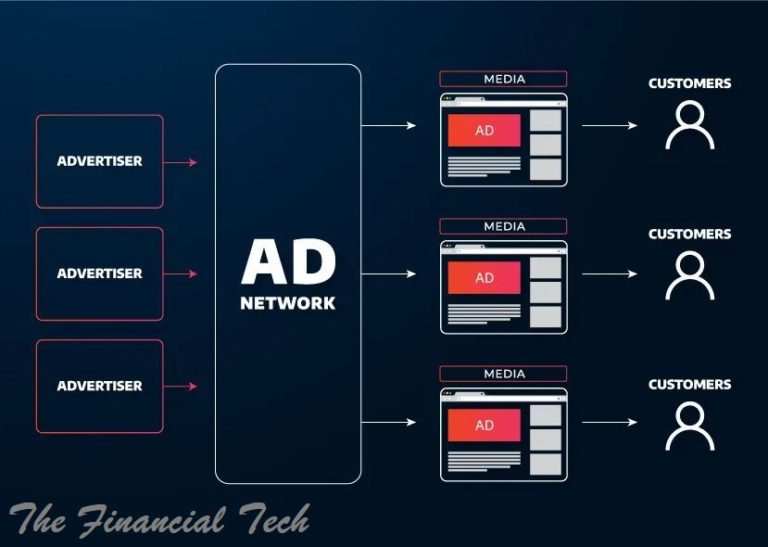
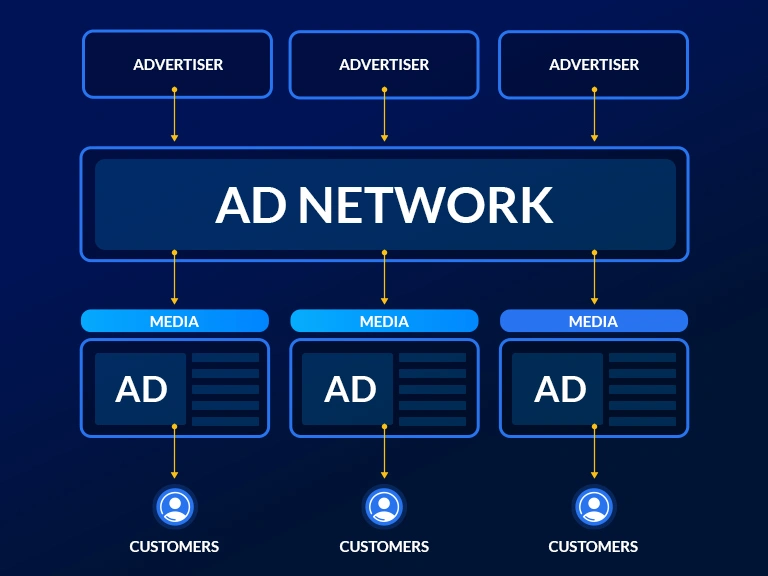
An ad network is a digital platform that acts as an intermediary between advertisers (who have messages to deliver) and publishers (who have ad space to sell) . Ad networks aggregate inventory from thousands or millions of publishers, bundle it by audience or context, and sell it to advertisers through a unified interface .
The core value proposition is simple: Instead of negotiating separate deals with hundreds of websites, you access massive reach through a single relationship, with consolidated reporting, payment, and optimization.
1.2 The Scale Advantage
The largest ad networks operate at staggering scale. Google’s Display Network alone reaches over 90% of global internet users across more than 2 million websites and apps . Meta (Facebook and Instagram) commands 24% of global digital ad spend with its hyper-granular demographic targeting . Amazon, the third-largest ad platform, sees approximately 2.5 billion monthly site visitors, all with demonstrated purchase intent .
This scale matters because 61% of marketers now use third-party data and ad networks to reach broader audiences . The math is simple: more inventory means more opportunities to find your customers.
1.3 Why Advertisers Choose Networks
Part 2: The Ad Network Ecosystem – How It All Fits Together
To use ad networks effectively, you must understand the broader ecosystem in which they operate. Modern digital advertising is powered by programmatic technology, where software automates the buying and selling of ad inventory.
2.1 Key Players in the Ecosystem
2.2 The Programmatic Flow
When a user visits a website, this sequence happens in milliseconds:
The publisher’s page sends a bid request to an ad exchange
The exchange broadcasts the request to multiple DSPs and networks
Your DSP evaluates the impression against your targeting criteria and places a bid
The highest bidder wins and their ad is served
The entire process completes before the page finishes loading
This real-time bidding (RTB) ecosystem now handles approximately two-thirds of all display advertising . For advertisers, it means your campaigns can compete for every relevant impression across millions of sites simultaneously.
Part 3: The Major Ad Networks – A Strategic Overview
3.1 Google Ads (formerly Google AdWords)
Google dominates digital advertising, accounting for nearly 30% of all digital ad spend . Its ad platform offers two primary campaign types:
Search Network: Text ads on Google search results pages. These capture users with active purchase intent—people searching for solutions your brand provides .
Display Network (GDN): Visual ads (images, responsive ads, video) across over 2 million websites, apps, and Google properties including YouTube and Gmail . This is a passive discovery channel ideal for building awareness and retargeting.
Why advertisers use Google:
Unmatched scale and reach
Sophisticated keyword, demographic, and interest targeting
Performance marketing focus with reliable ROI tracking
Integration with Google Analytics for cross-channel attribution
3.2 Meta Ads (Facebook and Instagram)
Meta commands 24% of global digital ad spend, making it the second-largest ad platform . Its strength lies in granular demographic and interest targeting based on real user profile data.
Key capabilities:
Target by location, age, gender, interests, behaviors, and connections
Create hyper-specific audiences (e.g., “cyclists in Minneapolis aged 18–30”)
Native ad formats (images, videos, carousels, collection ads) that blend into user feeds
2x higher user engagement and 3x user retention compared to standard banners
Recent 2025–2026 enhancements: Meta has expanded AI-powered tools for value-based optimization, allowing advertisers to optimize for profit margins, subscription value, or custom business goals rather than just conversions . New attribution options include incremental measurement and custom attribution integrated with third-party analytics.
3.3 Amazon Ads
Amazon has grown into the third-largest ad platform, generating over $30 billion annually . Its unique advantage: shoppers arrive with intent to buy.
Key offerings:
Sponsored Products, Sponsored Brands, and display ads across Amazon properties
Product targeting—show ads to users searching for or viewing similar items
Powerful ROAS reporting showing exactly how much incremental revenue ads generate
Amazon’s audience is composed almost entirely of people close to or at the buying stage, making it essential for e-commerce advertisers.
3.4 Specialized and Niche Networks
Beyond the triopoly, specialized networks offer access to unique audiences:
3.5 Commerce Media Networks
A rapidly growing category is commerce media networks (CMNs)—retailers and marketplaces opening their first-party data and inventory to advertisers . These include Walmart Connect, Instacart Ads, Uber Eats Ads, and countless others.
What makes CMNs unique:
Access to transactional first-party data—actual purchase history, not inferred behavior
High-intent audiences already in shopping mode
Entity-based targeting (specific products, categories, or brands)
For advertisers, CMNs represent the intersection of audience precision and purchase intent.
Part 4: Targeting Strategies – Finding Your Audience Across Networks
Modern ad networks offer a rich palette of targeting options. The key is matching the right strategy to your campaign objective.
4.1 The Targeting Taxonomy
4.2 Layered Audiences: The Precision Strategy
The most sophisticated advertisers use layered audience targeting—combining multiple criteria to narrow focus and eliminate waste .
How it works: Instead of relying on a single targeting dimension (e.g., “interested in fitness”), you layer multiple signals:
Demographics: age 25–40
Geography: within 25 miles of your stores
Behavior: visited competitor sites in last 30 days
Context: reading articles about marathon training
Each additional layer increases relevance but reduces reach. The art is finding the right balance for your objective.
Why layering matters:
Filters out irrelevant traffic automatically
Reduces exposure to fraudulent clicks (bots rarely match consistent audience signals)
Improves ad spend efficiency—every impression reaches a well-defined prospect
Strengthens brand safety by narrowing delivery to trusted contexts
4.3 Remarketing and Dynamic Remarketing
Remarketing (showing ads to users who previously visited your site) consistently delivers the highest conversion rates of any targeting method .
Standard remarketing: Show generic ads to all site visitors.
Dynamic remarketing: Takes personalization further by showing users the exact products or services they viewed . If a user looked at a specific pair of shoes on your site, dynamic remarketing serves an ad featuring those shoes, often with current pricing.
Implementation requirements:
Site-wide tagging with parameters capturing viewed products
Product feed (for e-commerce) or custom parameters (for lead generation)
Dynamic ad creative in your campaign
Dynamic remarketing consistently delivers 2–3x higher CTRs and 30–50% lower CPAs than generic remarketing.
4.4 Navigating the Cookieless Future
With third-party cookies deprecated, advertisers must adapt their targeting strategies. The platforms are evolving:
First-party data becomes paramount: Customer Match and similar audiences built from your own customer lists are privacy-resilient and increasingly valuable
Contextual targeting returns: Placing ads based on page content rather than user identity is making a comeback
Cohort-based approaches: Google’s Topics API, Meta’s aggregated event measurement
Universal IDs: Partnerships with identity solutions (Trade Desk’s UID2, LiveRamp) make authenticated inventory addressable
The advertisers who invest in collecting and activating first-party data will maintain targeting precision in the cookieless era.
Part 5: Campaign Structure – Setting Up for Success
5.1 The Three-Campaign Framework
The most disciplined advertisers separate campaigns by funnel stage, each with its own targeting, bidding, and creative approach.
Do not mix objectives within campaigns. Conflicting optimization signals confuse the platform’s algorithms and degrade performance .
5.2 Ad Group Structure: One Theme Per Group
Within each campaign, organize ad groups by single targeting themes :
Campaign: GDN_Conversions_Remarketing
├─ Ad Group: Cart_Abandoners
│  └─ Targeting: Website visitors who added to cart but didn't purchase
├─ Ad Group: High_Intent_Page_Viewers
│  └─ Targeting: Visitors to pricing page, demo page, or reviews
└─ Ad Group: Past_Purchasers_CrossSell
   └─ Targeting: Customer Match list (existing customers)
This structure allows you to tailor creative and bids to each audience segment’s specific intent level.
5.3 Creative Formats: Collaborating with Machine Learning
In 2026, ad creative strategy is a human-machine partnership . You provide raw materials; the platform’s algorithms assemble, test, and optimize combinations.
Responsive Display Ads (RDAs) are the default choice for most display campaigns. You upload multiple assets—headlines, descriptions, images, logos, videos—and Google dynamically combines them into various formats and sizes, testing winning combinations .
Asset requirements for optimal performance:
5+ headlines (vary length and angle: benefit-driven, question-based, urgency)
5+ descriptions (elaborate on value propositions)
3+ images (mix product shots, lifestyle shots, branded graphics)
2+ logos (ensure brand consistency)
1+ video (if available; video-enabled RDAs outperform image-only)
Uploaded image ads (static or HTML5) are reserved for situations requiring strict brand control or specific interactive elements .
5.4 The Power of Video
Video ads consistently outperform static display. Video CPMs can be 2–3x higher than display, but the engagement and conversion uplift often justifies the premium .
Video ad options:
In-stream: Pre-roll, mid-roll, post-roll on YouTube and partner sites
Out-stream: Video ads that appear within display placements, auto-playing in view
Bumper: Six-second, non-skippable videos for reach and frequency
Discovery: Video ads on YouTube search and watch next pages
Part 6: Bidding and Budget – Smart Strategies for 2026
6.1 Bidding Strategies by Objective
Recent developments: Meta now offers profit-based ROAS optimization, allowing advertisers to send profit margin data and optimize for profitable sales, not just revenue . This represents a significant evolution in value-based bidding.
6.2 Budget Management
Daily budget: Divide your monthly budget by 30.4 (average days per month)
Start conservative: Allow campaigns 7–14 days for the learning phase before significant adjustments
Monitor “Search Lost IS (Budget)”: If you’re losing impressions due to budget and ROAS is healthy, increase spend immediately
6.3 Cost Benchmarks (2026)
Note: Actual costs vary significantly by industry, competition, and targeting.
Part 7: Optimization – The Continuous Improvement Cycle
7.1 Regular Optimization Cadence
Create and follow an optimization schedule :
7.2 Asset Testing and Refinement
For Responsive Display Ads, platforms provide asset-level performance ratings (Low, Good, Best) :
Pause “Low” assets and replace with new variations
Create more assets similar to “Best” performers
Ensure asset diversity—different lengths, angles, and appeals
7.3 Placement Management
Underperforming placements are budget leaks. Regularly review placement reports and exclude sites, apps, or YouTube channels that generate high impressions but zero conversions .
Key metrics to monitor:
Viewability: Aim for 70%+; exclude placements below 50%
Invalid traffic: Watch for suspicious click patterns; use fraud detection tools
Conversion rate by placement: Shift budget to proven performers
Case study: Car rental firm Avis conducted a traffic audit and discovered 17% of paid clicks were invalid. After implementing automated exclusions, they achieved a 32% reduction in invalid traffic, 123% increase in conversions, and 27% decrease in CPA within three months .
7.4 Network Performance Review
For platforms offering multiple networks (e.g., Google Search Partners), check performance by network using the Segment feature . Search partner networks can be volatile—sometimes performing well, other times generating bot traffic. If a network consistently underperforms, consider excluding it.
7.5 Recommendations: Evaluate, Don’t Auto-Apply
Both Google and Microsoft provide optimization recommendations. Some are valuable; others serve platform interests. Turn off auto-apply for recommendations and review them manually .
That said, the Recommendations tab can be a source of ideas—new keywords, ad copy variants, bidding strategies—that you might not have considered .
Part 8: Measuring Success – Beyond Last-Click Attribution
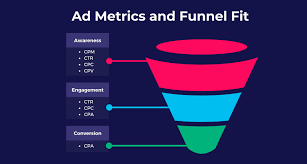
8.1 The Attribution Blind Spot
Last-click attribution—still default in many organizations—systematically undervalues upper-funnel channels like display advertising. Display ads rarely close sales; they initiate relationships.
Metrics you must track:
8.2 Platform-Specific Measurement Tools
Google: Ensure “View-through conv.” and “Cross-device conv.” are included in reporting columns
Meta: Incremental attribution functions optimize in real-time for conversions that wouldn’t have happened otherwise
Amazon: ROAS reporting shows incremental revenue from ad spend
8.3 Integrating Google Analytics 4 (GA4)
GA4 provides cross-channel attribution modeling essential for accurate evaluation:
Model comparison: Compare last-click vs. data-driven attribution
Audience creation: Build remarketing audiences from GA4 conversion events
Path analysis: Understand how display interacts with search, social, and direct traffic
Verify your ad platform and GA4 accounts are linked at the product level.
Part 9: Protecting Your Campaigns – Fraud, Brand Safety, and Quality
9.1 The Scale of the Problem
Ad fraud is projected to cost advertisers $172 billion annually by 2028, up from $88 billion in 2023 . Currently, fraud consumes 20–30% of digital ad spend—roughly $1 lost for every $3 invested .
Mobile apps are particularly vulnerable, with some reporting 28.5% invalid traffic (IVT) .
9.2 Quality Pillars
9.3 Protective Measures
Maintain exclusion lists: Regularly update lists of low-performing or unsafe domains
Use negative keywords: Avoid unsafe categories and irrelevant content
Verify with third-party tools: DoubleVerify, Integral Ad Science, ClickPatrol
Monitor for anomalies: Sudden spikes in clicks from specific geographies or IPs may indicate fraud
Part 10: The Advertiser’s 2026 Playbook – Key Takeaways
10.1 Start with Clear Objectives
Every campaign needs a single, well-defined objective. Structure your account accordingly: separate campaigns for awareness, consideration, and conversion .
10.2 Embrace Layered Targeting
Combine demographics, behaviors, and context to narrow focus and eliminate waste. Use remarketing for your highest-intent audiences .
10.3 Feed the Algorithms
Provide rich creative assets (multiple headlines, descriptions, images) and clear conversion signals. Let machine learning optimize combinations and bids .
10.4 Test Continuously
A/B test creative variations
Experiment with new bidding strategies
Try new ad formats and networks
10.5 Measure Full Value
Include view-through conversions, assisted conversions, and cross-device activity in your reporting. Use data-driven attribution where available .
10.6 Protect Your Spend
Regularly audit placements for quality and authenticity. Maintain exclusion lists. Use fraud detection tools .
10.7 Never Stop Learning
The platforms evolve constantly. Stay current with new features (like Meta’s profit-based optimization), test them thoughtfully, and incorporate what works .
Conclusion: Ad Networks as Strategic Partners
Ad networks in 2026 are not mere inventory aggregators. They are sophisticated, AI-driven platforms that, when used strategically, can deliver unprecedented reach, precision, and efficiency.
The expert advertiser’s mindset:
Architect by objective. Separate campaigns for each funnel stage.
Target with precision. Layer criteria to reach the right users in the right contexts.
Collaborate with AI. Feed the algorithms rich inputs and clear goals.
Measure holistically. Value display’s full contribution, not just last clicks.
Protect relentlessly. Guard against fraud and brand safety threats.
Optimize continuously. Testing and refinement are never “done.”
The question is not whether ad networks “work.” It is whether you are working them correctly.
Your audience is out there, across millions of sites and apps, waiting to discover your brand. Ad networks are the bridge. This guide is your map. Now cross it.